
HOUSTON, TX – March 20, 2024 – Itafos Inc. (TSX-V: IFOS) (the “Company”) reported today its Q4 and FY 2023 financial and operational highlights. The Company’s financial statements and management’s discussion and analysis for the year ended December 31, 2023 are available under the Company’s profile at www.sedarplus.ca and on the Company’s website at www.itafos.com. All figures are in thousands of US Dollars except as otherwise noted.
CEO Commentary
“We are pleased to report our 2023 financial results and the continuation of our strong safety and operational performance. For 2023, we reported revenues of $465.5 million and adjusted EBITDA of $131.8 million.
During Q4 2023, we continued to successfully execute our business plan and made significant progress on a number of key company objectives. Work continues on our Husky 1 / North Dry Ridge (“H1/NDR”) capital project with the project remaining on schedule and on budget. We now expect to begin mining activities in Q4 2025.
During Q4 2023, we saw prices continue to strengthen off the lows of Q2 2023, reflective of increasing demand and tighter US supply fundamentals. We expect to see these conditions continue into 2024. Going forward, the Company, will now provide guidance associated with our expected sales volumes, capital expenditures and other relevant financial metrics. This change is consistent with peers in the industry.
Finally, the process to explore and evaluate various strategic alternatives to enhance value for all Itafos shareholders announced by our Board in Q1 2023 continues.” said G. David Delaney, CEO of Itafos.
Q4 2023 Key Highlights
- revenues of $119.0 million
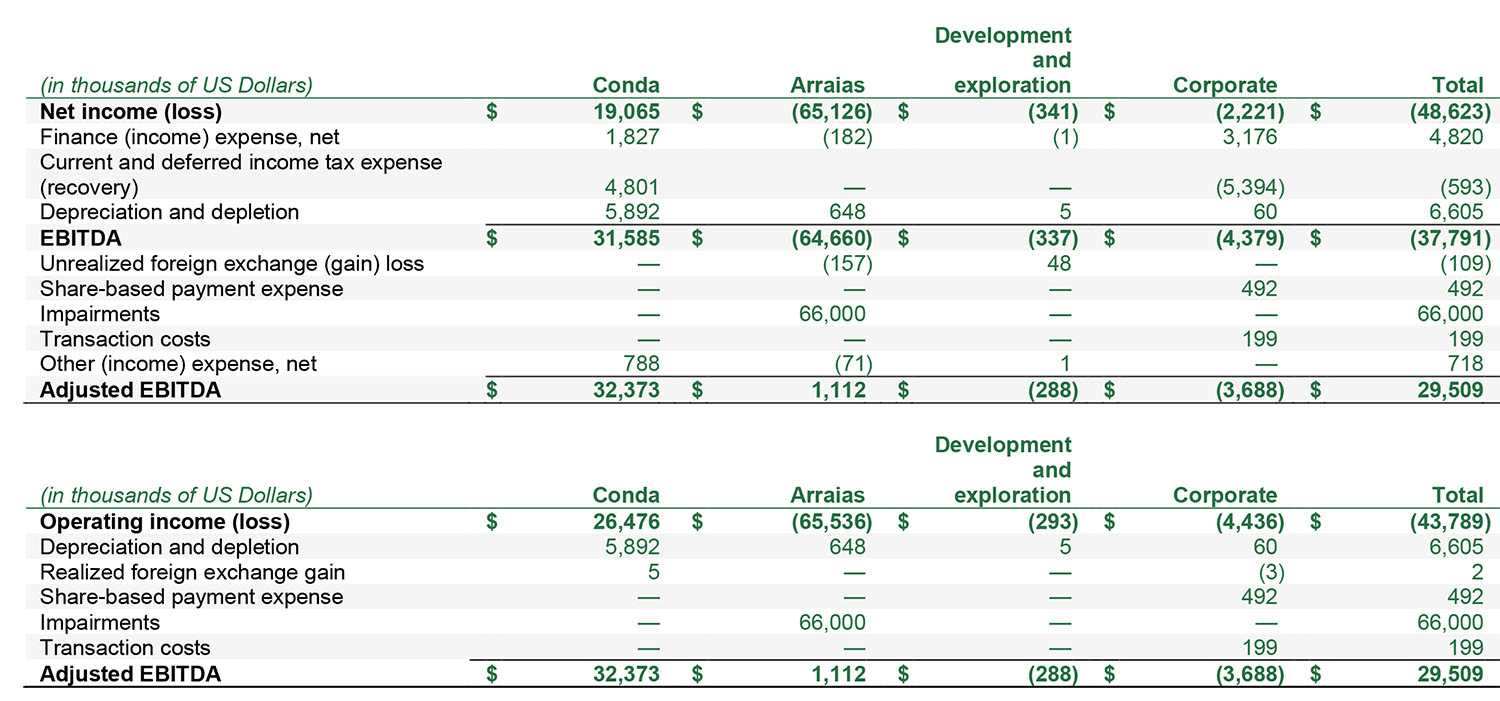
- Adjusted EBITDA of $29.5 million
- impairment of $66.0 million at Arraias
- net loss of $(48.6) million
- basic loss of C$(0.35)/share
- free cash flow of $23.3 million
FY 2023 Key Highlights
- revenues of $ 465.5 million
- Adjusted EBITDA of $ 131.8 million
- impairment of $66.0 million at Arraias
- net income of $ 3.1 million
- basic earnings of C$ 0.02/share
- free cash flow of $ 77.6 million
December 31, 2023 Key Highlights
- trailing 12 months Adjusted EBITDA of $ 131.8 million1
- net debt of $ 61.3 million1
- net leverage ratio of 0.5x1
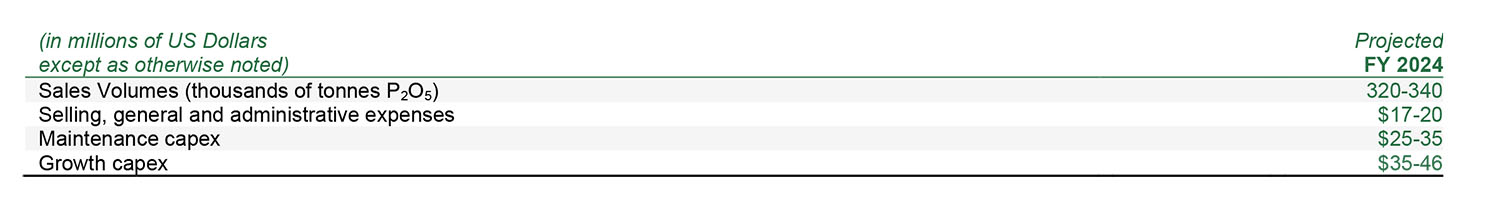
FY 2024 Guidance
- sales volumes guidance of 320-340 thousands of tonnes P2O52
- selling, general and administrative expenses guidance of $17-20 million3
- maintenance capex guidance of $25-35 million1
- growth capex guidance of $35-46 million1
Q4 and FY 2023 Market Highlights
Diammonium phosphate (“DAP”) New Orleans (“NOLA”) prices averaged $545/st in Q4 2023 compared to $672/st in Q4 2022, down 19% year-over-year, and averaged $548/st in FY 2023 compared to $772/st in FY 2022, down 29% year-over-year. Specific factors driving the year-over-year decline in DAP NOLA were as follows:
- weakened demand in response to historically high 2022 phosphate prices;
- the softening of global ammonia and sulfur prices;
- the softening of historically high crop prices; and
- increased phosphate exports out of Russia and China.
Q4 2023 Financial Highlights
For Q4 2023, the Company’s financial highlights were as follows:
- revenues of $119.0 million in Q4 2023 compared to $135.2 million in Q4 2022;
- Adjusted EBITDA of $29.5 million in Q4 2023 compared to $50.1 million in Q4 2022;
- impairment of $66.0 million at Arraias in Q4 2023 compared to $0 million in Q4 2022;
- net income (loss) of $(48.6) million in Q4 2023 compared to $29.3 million in Q4 2022;
- basic earnings (loss) of C$(0.35)/share in Q4 2023 compared to C$0.21/share in Q4 2022; and
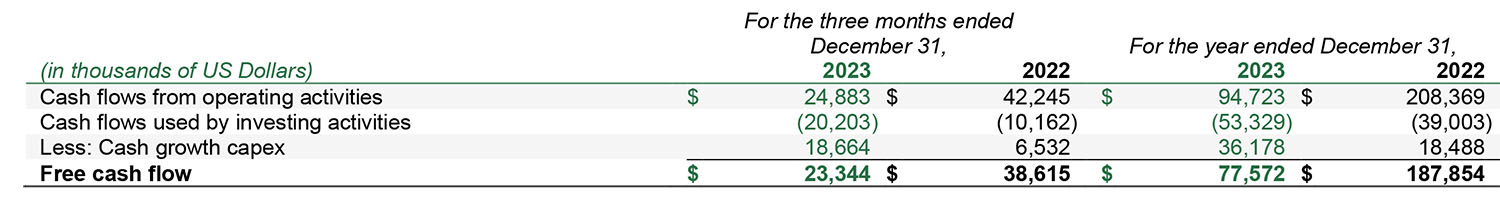
- free cash flow of $23.3 million in Q4 2023 compared to $38.6 million in Q4 2022.
The decrease in the Company’s Q4 2023 financial performance compared to Q4 2022 was primarily due to lower realized prices as a result of softer global market conditions and the impairment of non-current assets of Arraias, partially offset by higher sales volumes and lower input costs.
The Company’s total capex2 spend in Q4 2023 was $21.2 million compared to $9.9 million in Q4 2022 with the increase primarily due to the mine development activities at H1/NDR at Conda.
FY 2023 Financial Highlights
For FY 2023, the Company’s financial highlights were as follows:
- revenues of $465.5 million in FY 2023 compared to $593.3 million in FY 2022;
- Adjusted EBITDA of $131.8 million in FY 2023 compared to $224.8 million in FY 2022;
- impairment of $66.0 million at Arraias in FY 2023 compared to $0 million in FY 2022;
- net income of $3.1 million in FY 2023 compared to $114.7 million in FY 2022;
- basic earnings (loss) of C$0.02/share in FY 2023 compared to C$0.79/share in FY 2022; and
- free cash flow of $77.6 million in FY 2023 compared to $187.9 million in FY 2022.
The decrease in the Company’s FY 2023 financial performance compared to FY 2022 was primarily due to lower realized prices and the impairment of non-current assets of Arraias, partially offset by lower input costs.
The Company’s total capex4 spend in FY 2023 was $58.4 million compared to $39.9 million in FY 2022 with the increase primarily due to development activities at H1/NDR at Conda.
December 31, 2023 Highlights
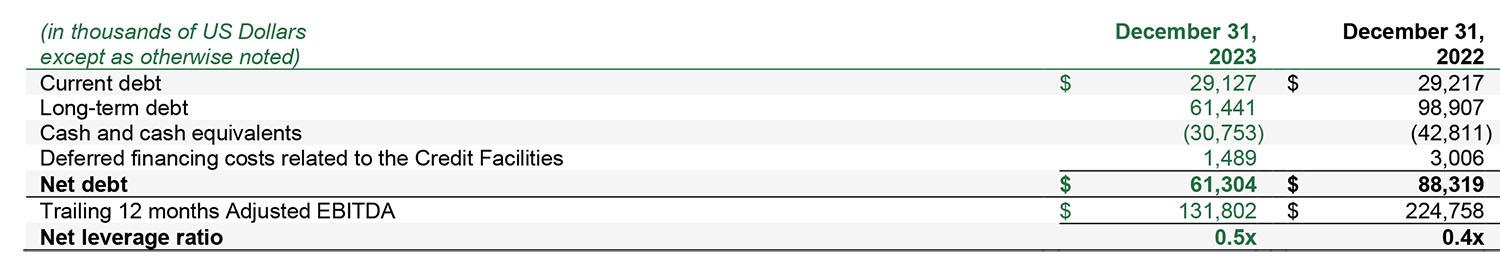
As at December 31, 2023, the Company had trailing 12 months Adjusted EBITDA of $131.8 million compared to $224.8 million at the end of 2022 with the decrease primarily due to the same factors that resulted in lower revenues, partially offset by lower input costs at Conda.
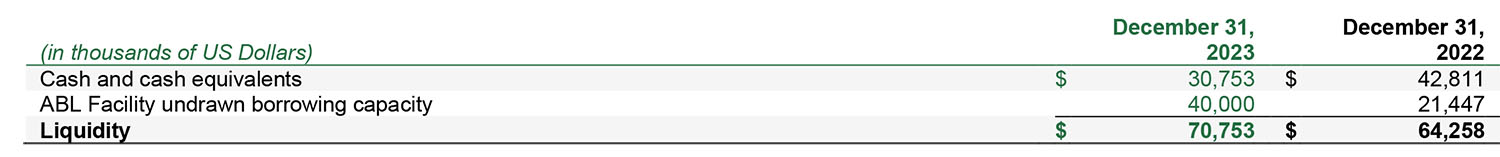
At December 31, 2023, the Company had net debt of $61.3 million compared to $88.3 million at the end of 2022, with the reduction due to the repayment of principal debt outstanding from free cash flows generated, which was partially offset by lower cash and cash equivalents. The Company’s net debt as at December 31, 2023 was comprised of $30.8 million in cash and $90.5 million in debt (gross of deferred financing costs). As at December 31, 2023 and the end of 2022, the Company’s net leverage ratio was 0.5x.
As at December 31, 2023, the Company had liquidity5 of $70.8 million comprised of $30.8 million in cash and $40.0 million in undrawn borrowing capacity under its $80 million asset-based revolving credit facility (the “ABL Facility”).
Q4 2023 Operational Highlights
Environmental, Health, and Safety (“EHS”)
- Sustained EHS performance, including no reportable environmental releases and one recordable incidents, which resulted in a consolidated total recordable incident frequency rate (“TRIFR”) of 0.57.
Conda
- Produced 95,719 tonnes P2O5 at Conda in Q4 2023 compared to 89,226 tonnes P2O5 in Q4 2022 with the increase primarily due to production efficiencies from improved uptime and better recoveries;
- Generated revenues of $112.4 million at Conda in Q4 2023 compared to $129.3 million in Q4 2022 with the decrease primarily due to lower realized selling prices, which were partially offset by higher sales volumes; and
- Generated Adjusted EBITDA at Conda of $32.4 million in Q4 2023 compared to $54.8 million in Q4 2022 with the decrease primarily due to the same factors that resulted in lower revenues, which were partially offset by lower input costs.
Q4 2023 Other Highlights
- Produced 34,087 tonnes of sulfuric acid at Arraias in Q4 2023 compared to 35,895 tonnes in Q4 2022 with the decrease primarily due to reduced sulfuric acid and sulfur inventory management in Q4 2023;
- Successfully started the production of Direct Application Phosphate Rock (“DAPR”) at Arraias by producing 643 tonnes P2O5 in Q4 2023 compared to 0 tonnes P2O5 in Q4 2022 with the increase due to the full quarter of DAPR production and sales per Fertilizer Restart Program;
- Generated Adjusted EBITDA at Arraias of $1.1 million in Q4 2023 compared to $0 million in Q4 2022 with the increase primarily due to higher sulfuric acid volume and lower cost of goods sold generating gross margin improvement and commencement of DAPR sales; and
- Recorded an impairment of non-current assets of $66 million at Arraias.
FY 2023 Operational Highlights
EHS
- Sustained EHS performance, including no reportable environmental releases and five recordable incidents, which resulted in a consolidated TRIFR of 0.57.
Conda
- Produced 349,030 tonnes P2O5 at Conda in Q4 2023 compared to 343,526 tonnes P2O5 in Q4 2022 with the increase primarily due to better recoveries;
- Generated revenues of $448.1 million at Conda in Q4 2023 compared to $571.1 million in Q4 2022 with the decrease primarily due to lower realized selling prices. Elevated prices in the prior year driven primarily by the Russian invasion of Ukraine and the three-month lagged pricing impact on Conda’s MAP contract;
- Generated Adjusted EBITDA at Conda of $148.1 million in Q4 2023 compared to $240.2 million in Q4 2022 with the decrease primarily due to the same factors that resulted in lower revenues, which were partially offset by lower input costs;
- On April 24, 2023, the Company announced the Record Of Decision for the H1/NDR mine development project. The H1/NDR project comprises primarily of civil activities and infrastructure development. Mineral resources from H1/NDR are expected from 20256 onward, providing an uninterrupted supply as Rasmussen Valley Mine reaches the end of its useful life;
- On May 8, 2023, the Company received the Notice to Proceed (“NTP”) for the H1/NDR mine development project. Upon receipt of the NTP, the Company commenced capital activities associated with the mine development project;
- Advanced H1/NDR capital activities including earthworks and related water management features for the rail loadout and haul road, improvement of the maintenance shop, and existing road relocation;
- Advanced development, including engineering of key infrastructure and progression of related magnesium oxide reduction initiatives to enhance SPA production and sales volumes, including continuation of test work;
- On September 7, 2023, the Company announced that it entered into a MAP Offtake Agreement with J.R. Simplot Company, an international food and agriculture company. The Company will sell 100% of the MAP produced by Conda to the J.R. Simplot Company during the term of the MAP Offtake Agreement, which commenced on January 1, 2024, with a term of five years. The MAP Offtake Agreement will replace the existing MAP sales agreement dated January 12, 2018, between the Company and Nutrien, which expired on December 31, 2023; and
- On September 7, 2023, the Company entered into a new ammonia supply contract with a subsidiary of Nutrien, which commenced on January 1, 2024, with a term of two years. The new ammonia supply contract replaces the current supply contract dated January 12, 2018, between the Company and Nutrien which expired on December 31, 2023.
FY 2023 Other Highlights
- Produced 89,075 tonnes of sulfuric acid at Arraias in FY 2023 compared to 99,030 tonnes in FY 2022 with the decrease due to the sulfuric acid plant shutdown for required maintenance in April and May;
- Produced 5,196 tonnes P2O5 of DAPR at Arraias in FY 2023 compared to 0 tonnes P2O5 in FY 2022 the increase due to the full year of DAPR production and sales per Fertilizer Restart Program;
- Generated Adjusted EBITDA at Arraias of $0.4 million in FY 2023 compared to $0.1 million loss in FY 2022 with the increase primarily due to higher sulfuric acid volume and lower cost of goods sold generating gross margin improvement and commencement of DAPR sales;
- On June 28, 2023, the Company filed the NI 43-101 technical report for the Farim Phosphate Project; and
- Recorded an impairment of non-current assets of $66 million at Arraias.
Market Outlook
Prices in 2023 have moderated off the historically high prices in 2022. The Company’s 2023 performance was impacted due to a very competitive summer price reset and the three-month lagging average of our MAP contract. Despite the decrease, the Company has seen an extremely strong fall season, resulting in improved pricing from the summer and continued tightening of North American phosphate fertilizer supply. The Company expects a relative stable market moving forward due to the ongoing tight supply situation coupled with softer crop prices.
Specific factors the Company expects to support moderate pricing in the global phosphate fertilizer markets through the end of 2024 are as follows:
- no significant phosphate supply capacity additions;
- strong demand for phosphates in North America following years of under application;
- softening of crop prices from historical highs; and
- ongoing phosphate export restrictions from China and reduced exports from Morocco.
Financial Outlook
The Company’s guidance for 2024 is as follows:
Business Outlook
The Company continues to focus on the following key objectives to drive long-term value and shareholder returns:
- improving financial and operational performance;
- executing on the infrastructure and civil works required for the mine development for H1/NDR; and
- conducting the strategic review process (including evaluating potential strategic alternatives for the Company as outlined in the news release dated March 13, 2023).
About Itafos
The Company is a phosphate and specialty fertilizer company. The Company’s businesses and projects are as follows:
- Conda – a vertically integrated phosphate fertilizer business located in Idaho, US with production capacity as follows:
- approximately 550kt per year of monoammonium phosphate (“MAP”), MAP with micronutrients (“MAP+”), superphosphoric acid (“SPA”), merchant grade phosphoric acid (“MGA”) and ammonium polyphosphate (“APP”); and
- approximately 27kt per year of hydrofluorosilicic acid (“HFSA”);
- Arraias – a vertically integrated phosphate fertilizer business located in Tocantins, Brazil with production capacity as follows:
- approximately 500kt per year of single superphosphate (“SSP”) and SSP with micronutrients (“SSP+”); and
- approximately 40kt per year of excess sulfuric acid (220kt per year gross sulfuric acid production capacity);
- Farim – a high-grade phosphate mine project located in Farim, Guinea-Bissau;
- Santana – a vertically integrated high-grade phosphate mine and fertilizer plant project located in Pará, Brazil; and
- Araxá – a vertically integrated rare earth elements and niobium mine and extraction plant project located in Minas Gerais, Brazil.
As at December 31, 2023 the Company has completed the wind down process of the Mantaro mine project (located in Junin, Peru).
The Company is a Delaware corporation that is headquartered in Houston, TX. The Company’s shares trade on the TSX Venture Exchange (“TSX-V”) under the ticker symbol “IFOS”. The Company’s principal shareholder is CL Fertilizers Holding LLC (“CLF”). CLF is an affiliate of Castlelake, L.P., a global private investment firm.
For more information, or to join the Company’s mailing list to receive notification of future news releases, please visit the Company’s website at www.itafos.com.
Forward-Looking Information
Certain information contained in this news release constitutes forward-looking information, including statements with respect to: the Company’s planned operations and strategies; the timing for commencement of operations at H1 / NDR; the expected resource life of H1 / NDR; the sources of funding to be used for the development of H1 / NDR; and economic and market trends with respect to the global agriculture and phosphate fertilizer markets. All information other than information of historical fact is forward-looking information. Statements that address activities, events or developments that the Company believes, expects or anticipates will or may occur in the future include, but are not limited to, statements regarding estimates and/or assumptions in respect of the Company’s financial and business outlook are forward-looking information. The use of any of the words “intend”, “anticipate”, “plan”, “continue”, “estimate”, “expect”, “may”, “will”, “project”, “should”, “would”, “believe”, “predict” and “potential” and similar expressions are intended to identify forward-looking information.
The forward-looking information contained in this news release is based on the opinions, assumptions and estimates of management set out herein, which management believes are reasonable as at the date the statements are made. Those opinions, assumptions and estimates are inherently subject to a variety of risks and uncertainties and other known and unknown factors that could cause actual events or results to differ materially from those projected in the forward-looking information. These include the Company’s expectations and assumptions with respect to the following: commodity prices; operating results; safety risks; changes to the Company’s mineral reserves and resources; risk that timing of expected permitting will not be met; changes to mine development and completion; foreign operations risks; changes to regulation; environmental risks; the impact of adverse weather and climate change; general economic changes, including inflation and foreign exchange rates; the actions of the Company’s competitors and counterparties; financing, liquidity, credit and capital risks; the loss of key personnel; impairment risks; cybersecurity risks; risks relating to transportation and infrastructure; changes to equipment and suppliers; adverse litigation; changes to permitting and licensing; geo-political risks; loss of land title and access rights; changes to insurance and uninsured risks; the potential for malicious acts; market volatility; changes to technology; changes to tax laws; the risk of operating in foreign jurisdictions; and the risks posed by a controlling shareholder and other conflicts of interest. Readers are cautioned that the foregoing list of risks, uncertainties and assumptions is not exhaustive.
Although the Company has attempted to identify crucial factors that could cause actual actions, events or results to differ materially from those described in forward-looking information, there may be other factors that cause actions, events or results not to be as anticipated, estimated or intended. Additional risks and uncertainties affecting the forward-looking information contained in this news release are described in greater detail in the Company’s current Annual Information Form and current Management’s Discussion and Analysis available under the Company’s profile on SEDAR+ at www.sedarplus.ca and on the Company’s website at www.itafos.com. There can be no assurance that forward-looking information will prove to be accurate, as actual results and future events could differ materially from those anticipated in such information. The reader is cautioned not to place undue reliance on forward-looking information. The Company undertakes no obligation to update forward-looking statements if circumstances or management’s estimates, assumptions or opinions should change, except as required by applicable securities law. The forward-looking information included in this news release is expressly qualified by this cautionary statement and is made as of the date of this news release.
This news release contains future-oriented financial information and financial outlook information (together, “FOFI”) about the Company’s prospective results of operations, including statements regarding expected adjusted EBITDA, net income, basic earnings per share, maintenance capex, growth capex and free cash flow. FOFI is subject to the same assumptions, risk factors, limitations and qualifications as set forth in the above paragraph. The Company has included the FOFI to provide an outlook of management’s expectations regarding anticipated activities and results, and such information may not be appropriate for other purposes. The Company and management believe that the FOFI has been prepared on a reasonable basis, reflecting management’s reasonable estimates and judgements; however, actual results of operations and the resulting financial results may vary from the amounts set forth herein. Any financial outlook information speaks only as of the date on which it is made and the Company undertakes no obligation to publicly update or revise any financial outlook information except as required by applicable securities laws.
NEITHER THE TSX-V NOR ITS REGULATION SERVICES PROVIDER (AS THAT TERM IS DEFINED IN THE POLICIES OF THE TSX-V) ACCEPTS RESPONSIBILITY FOR THE ADEQUACY OR ACCURACY OF THIS NEWS RELEASE.
For further information, please contact:
Matthew O’Neill
Itafos Investor Relations
investor@itafos.com
713-242-8446
Scientific and Technical Information
The scientific and technical information contained in this news release related to Mineral Resources for Conda and Farim has been reviewed and approved by Jerry DeWolfe, Professional Geologist (P.Geo.) with the Association of Professional Engineers and Geoscientists of Alberta. Mr. DeWolfe is a full-time employee of WSP Canada Inc. and is independent of the Company. The scientific and technical information contained in this news release related to Mineral Reserves for Conda and Farim has been reviewed and approved by Edward Minnes, Professional Engineer (P.E.) licensed by the State of Missouri. Mr. Minnes is a part-time employee of WSP USA Inc. and is independent of the Company. The Company’s latest technical report in respect of Conda is entitled, “NI 43-101 Technical Report on Itafos Conda and Paris Hills Mineral Projects, Idaho, USA,” with an effective date of July 1, 2019 (the “Conda Technical Report”) and is available under the Company’s website at www.itafos.com and under the Company’s profile on SEDAR+ at www.sedarplus.ca
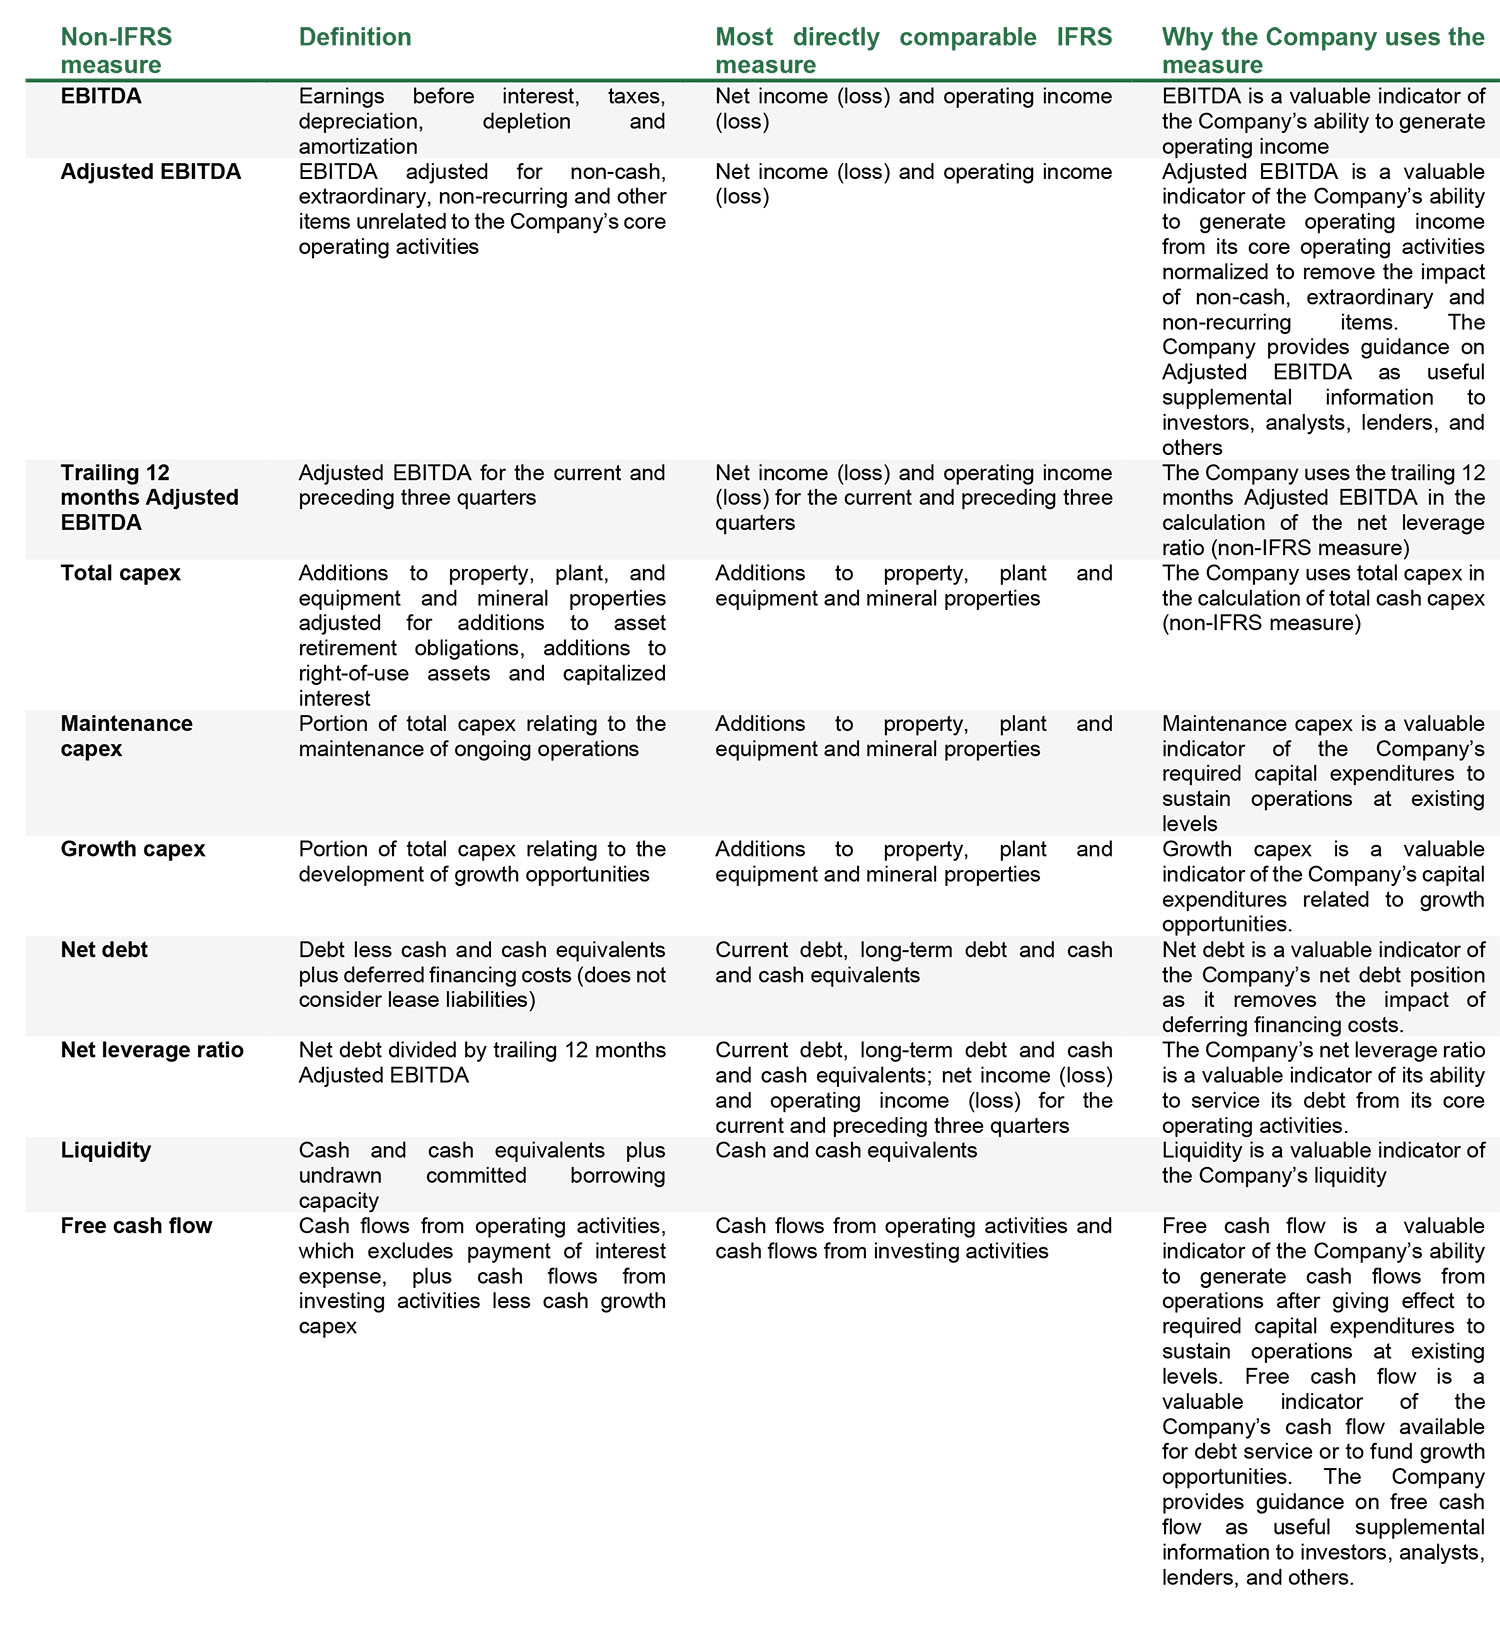
Non-IFRS Financial Measures
This press release contains both IFRS and certain non-IFRS measures that management considers to evaluate the Company’s operational and financial performance. Non-IFRS measures are a numerical measure of a company’s performance, that either include or exclude amounts that are not normally included or excluded from the most directly comparable IFRS measures. Management believes that the non-IFRS measures provide useful supplemental information to investors, analysts, lenders and others. In evaluating non-IFRS measures, investors, analysts, lenders and others should consider that non-IFRS measures do not have any standardized meaning under IFRS and that the methodology applied by the Company in calculating such non-IFRS measures may differ among companies and analysts. Non-IFRS measures should not be considered as a substitute for, nor superior to, measures of financial performance prepared in accordance with IFRS. Definitions and reconciliations of non-IFRS measures to the most directly comparable IFRS measures are included below.
DEFINITIONS
The Company defines its non-IFRS measures as follows:
EBITDA, ADJUSTED EBITDA AND TRAILING 12 MONTHS ADJUSTED EBITDA
For the three months ended December 31, 2023 and 2022
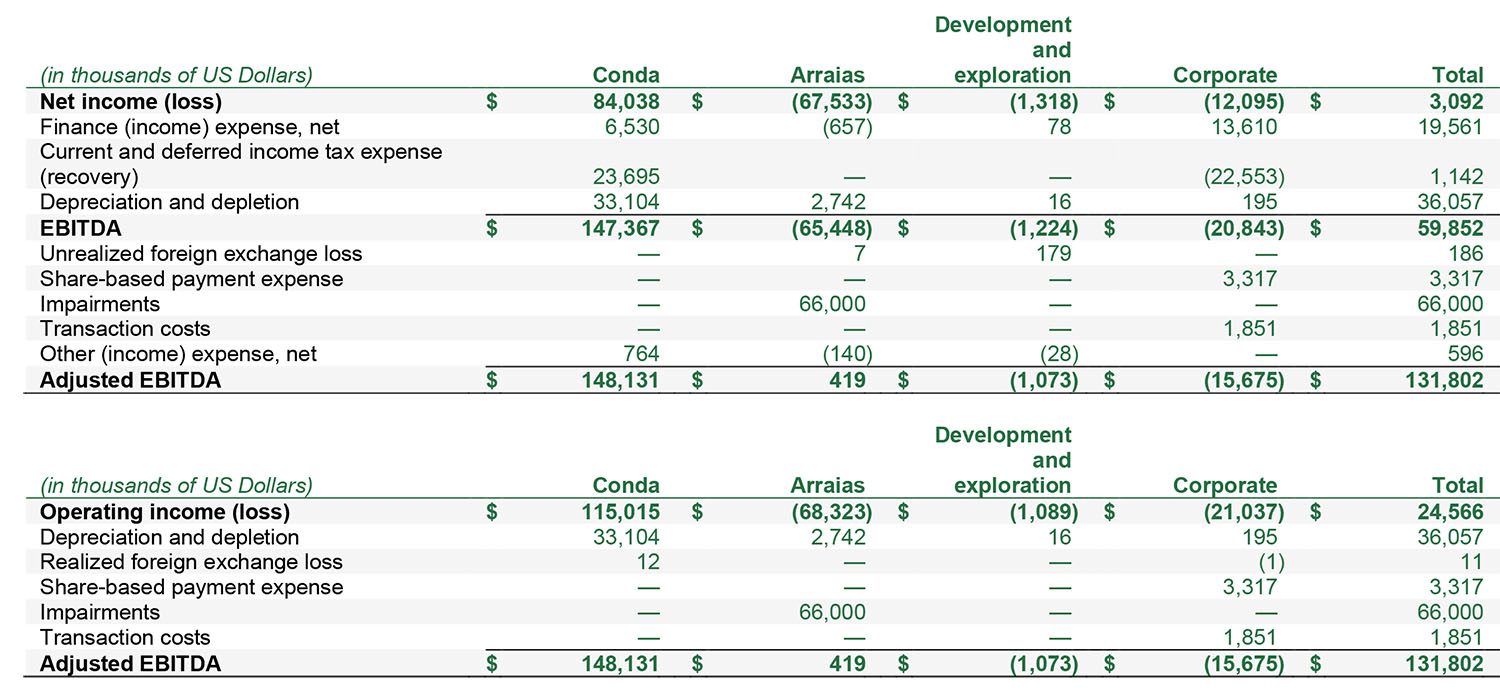
For the three months ended December 31, 2023, the Company had EBITDA and Adjusted EBITDA by segment as follows:
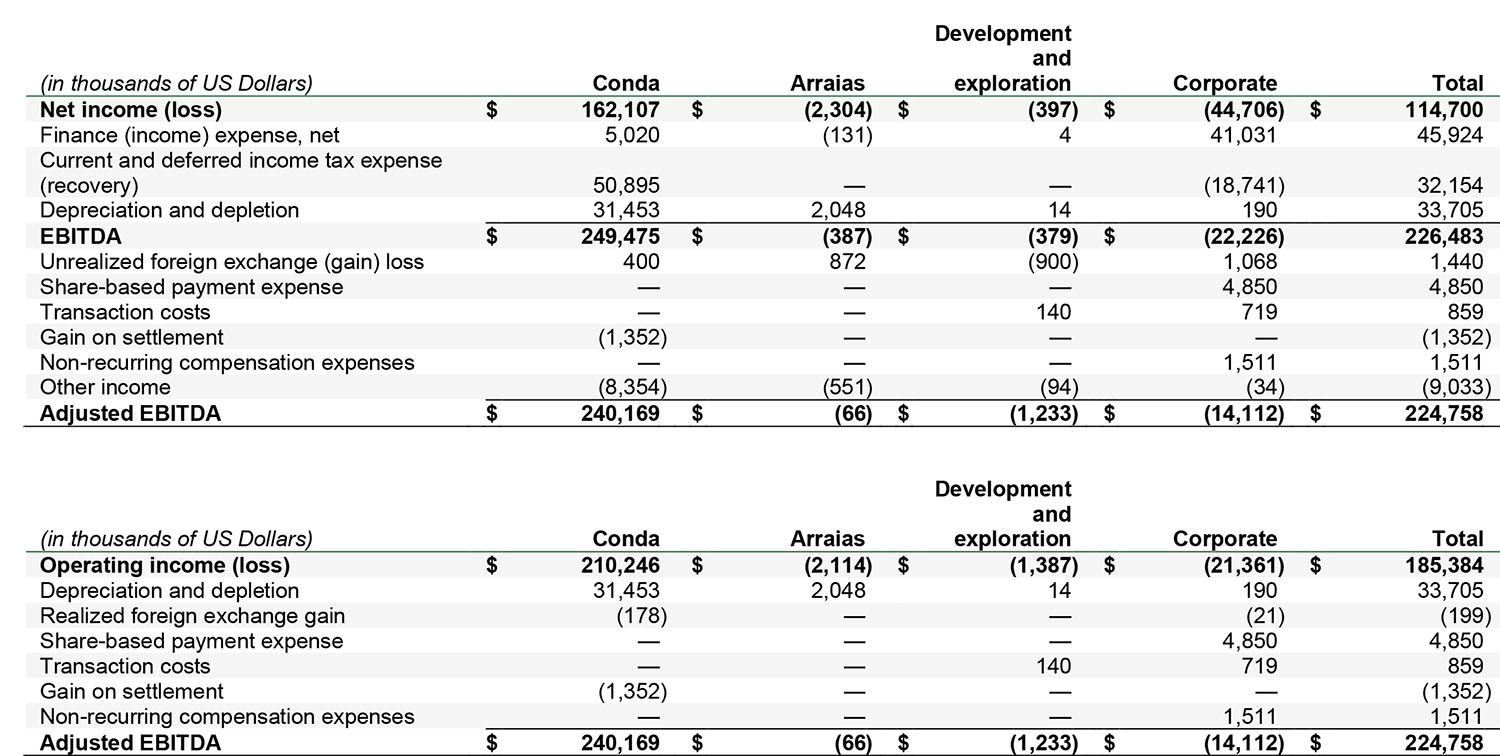
For the three months ended December 31, 2022, the Company had EBITDA and Adjusted EBITDA by segment as follows:
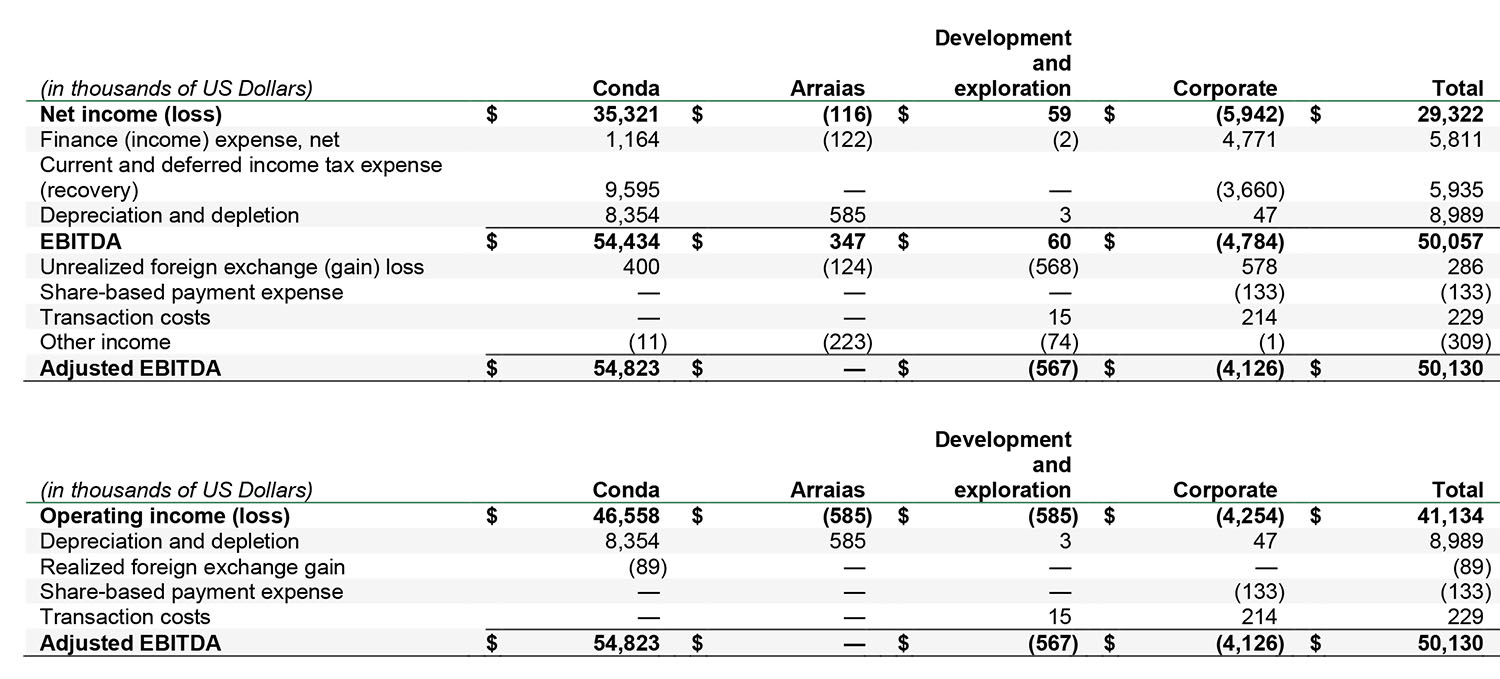
For the year ended December 31, 2023 and 2022
For the year ended December 31, 2023, the Company had EBITDA and Adjusted EBITDA by segment as follows:
For the year ended December 31, 2022, the Company had EBITDA and Adjusted EBITDA by segment as follows:
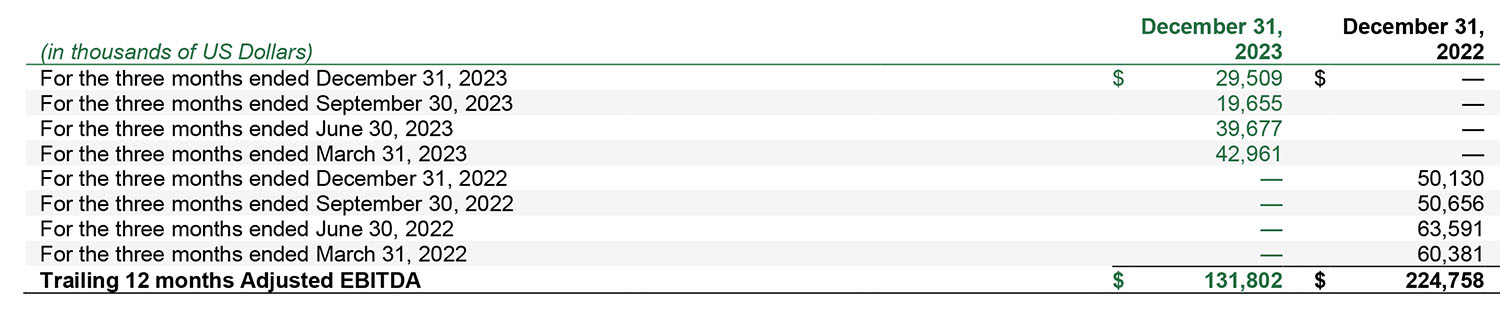
As at December 31, 2023 and 2022
As at December 31, 2023 and 2022, the Company had trailing 12 months Adjusted EBITDA as follows:
TOTAL CAPEX
For the three months ended December 31, 2023 and 2022
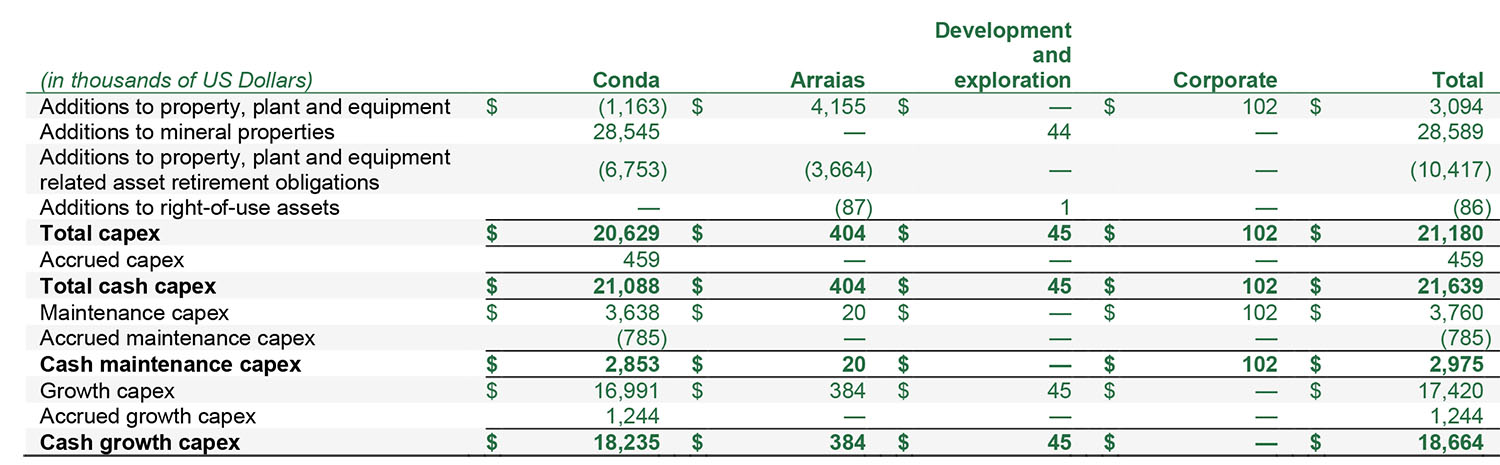
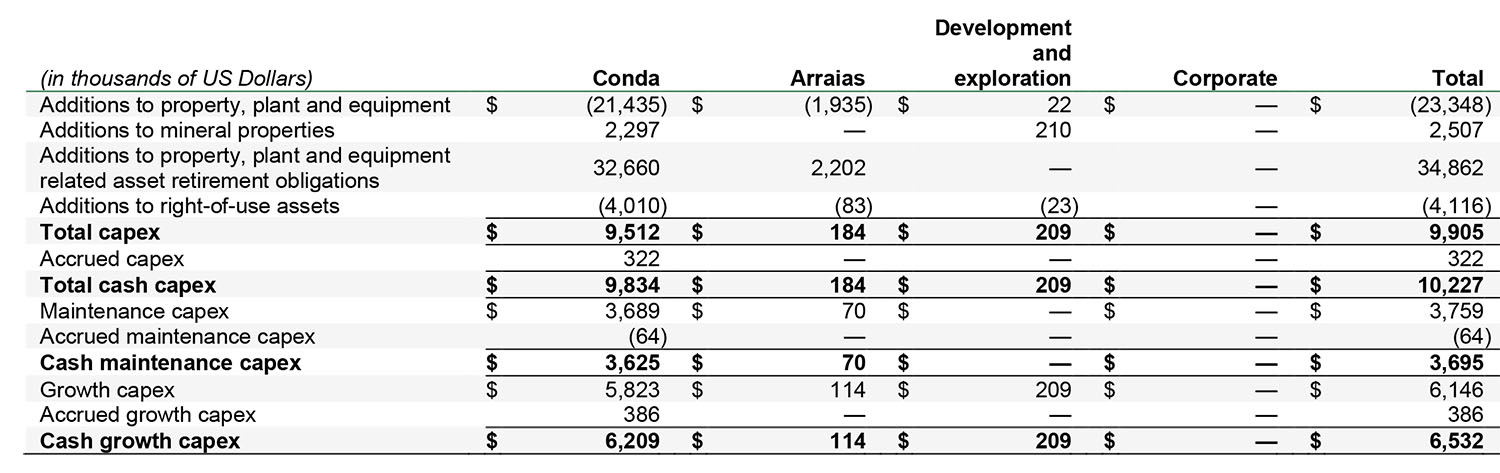
For the three months ended December 31, 2023, the Company had capex by segment as follows:
For the three months ended December 31, 2022, the Company had capex by segment as follows:
For the years ended December 31, 2023 and 2022
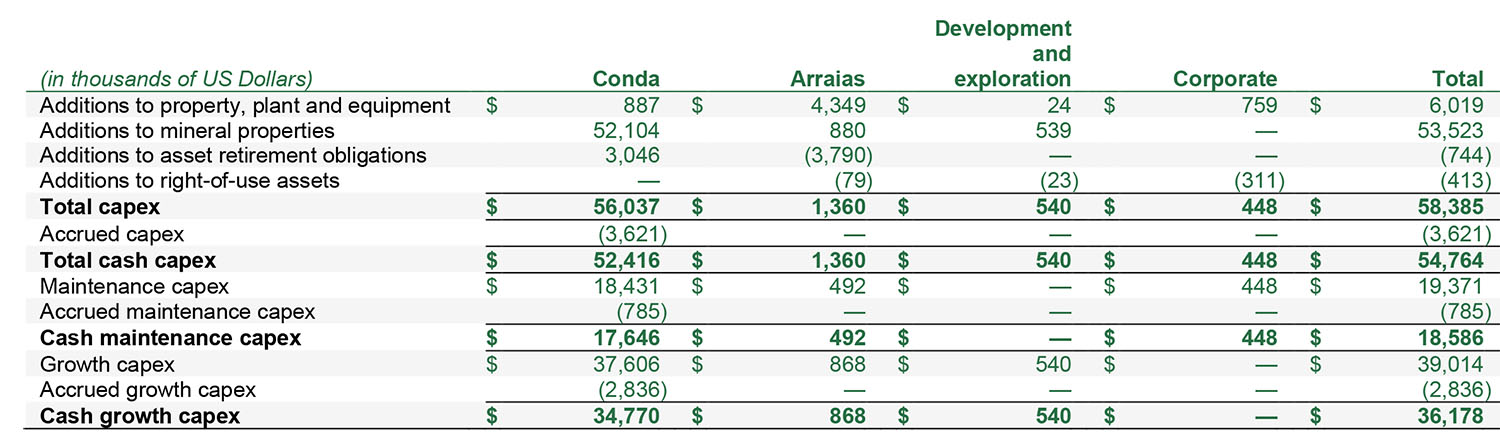
For the year ended December 31, 2023, the Company had capex by segment as follows:
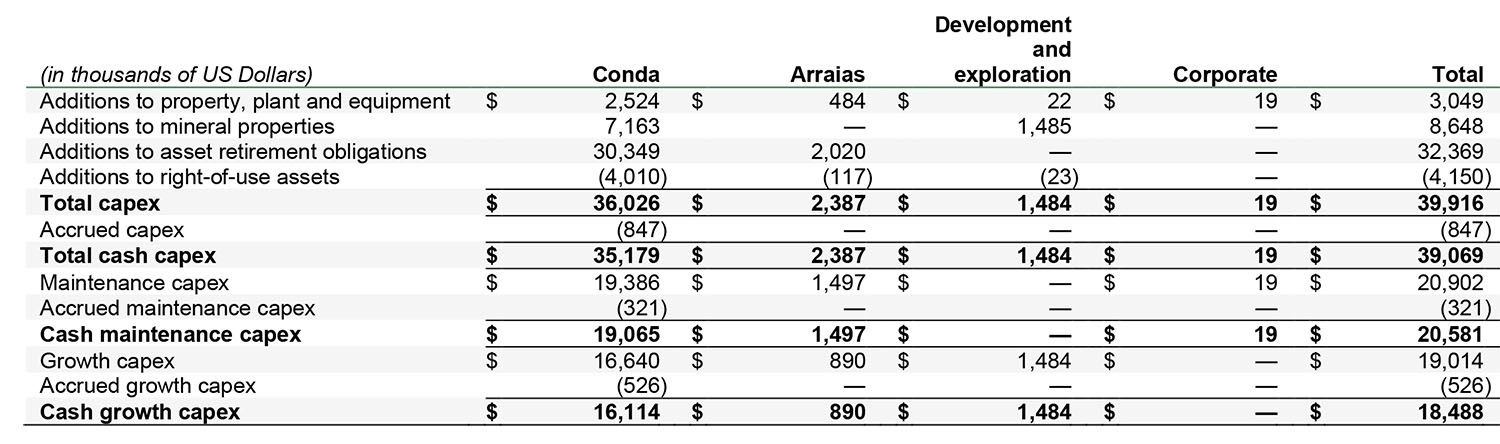
For the year ended December 31, 2022, the Company had capex by segment as follows:
NET DEBT AND NET LEVERAGE RATIO
As at December 31, 2023, and 2022 the Company had net debt and net leverage ratio as follows:
LIQUIDITY
As at December 31, 2023, and 2022 the Company had liquidity as follows:
FREE CASH FLOW
For the three months and years ended December 31, 2023 and 2022, the Company had free cash flow as follows:
1 Adjusted EBITDA, trailing 12 months Adjusted EBITDA, maintenance capex, growth capex, net debt, net leverage ratio and free cash flow are each a non-IFRS financial measure. For additional information on non-IFRS financial measures, see “Non-IFRS financial measures” below.
2 Sales volumes reflect quantity in P2O5 of Conda sales projections.
3 Selling, general and administrative expenses (“SG&A”) is Corporate SG&A less share-based payment expense.
4 Total capex is a non-IFRS financial measure. For additional information on non-IFRS and other financial measures, see “Non-IFRS financial measures” below.
5 Liquidity is a non-IFRS financial measure. For additional information on non-IFRS and other financial measures, see “Non-IFRS financial measures” below.
6 Timeline for H1/NDR based on management estimates and subject to certain assumptions, including successful permitting and development activities. The H1/NDR mine life extension is based on a Preliminary Economic Assessment (“2019 PEA”) included in the Conda Technical Report (as defined below). The 2019 PEA on the H1 and NDR properties is preliminary in nature and includes inferred mineral resources that are considered too speculative geologically to have the economic considerations applied to them that would enable them to be categorized as mineral reserves, and there is no certainty that the 2019 PEA will be realized. Readers are referred to the Conda Technical Report for the applicable qualifications and assumptions in connection with its 2019 PEA.